Introduction: The Power of Dynamic Pivot Tables
Unlock the potential of your data with the art of dynamic pivot tables in PostgreSQL. Imagine having the ability to reshape your data, transform rows into columns, and create dynamic summaries that enhance your data visualization and analysis. In this journey, we’ll unravel the technique behind dynamic pivot tables, from understanding the pivoting process to implementing it in real-world scenarios.
Section 1: Pivoting Unveiled: The Concept and Application
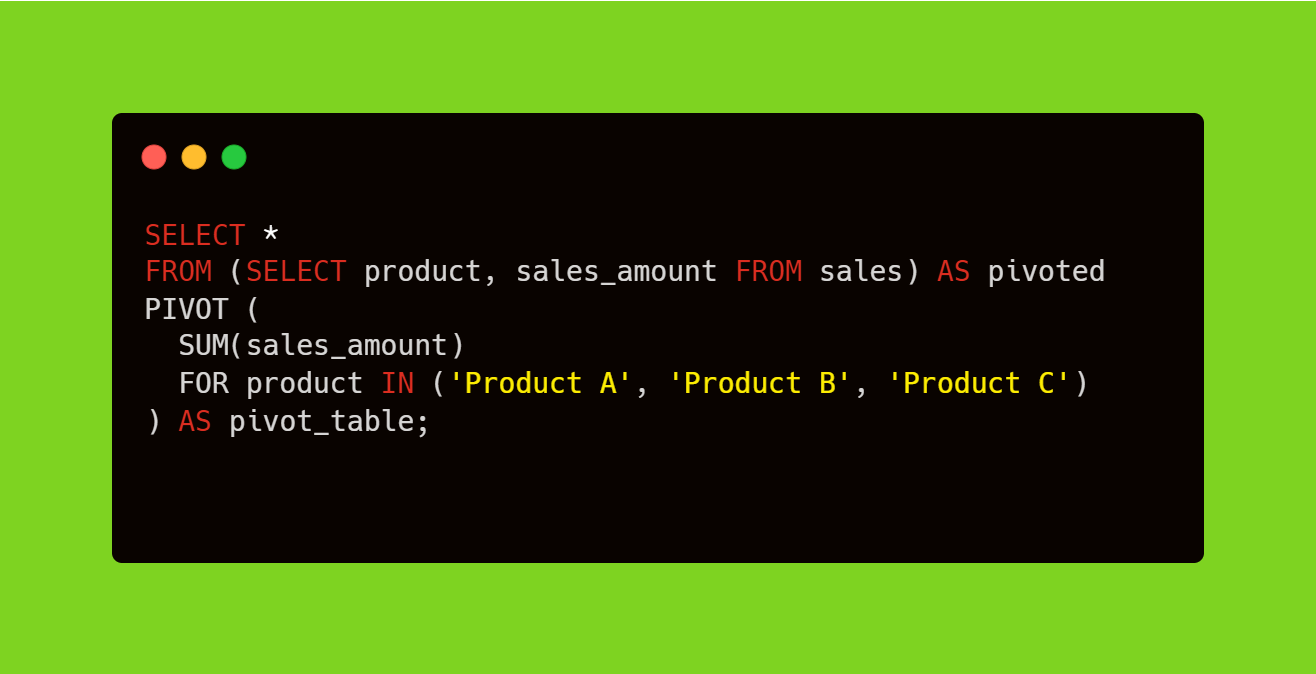
Pivoting is the transformative process that shifts your data’s orientation from rows to columns. By doing so, you create a compact representation that’s easier to comprehend and analyze. Let’s consider a hypothetical sales dataset. To pivot the data and display sales for each product in separate columns:
Section 2: Dynamic Pivoting: Adapting to Evolving Data
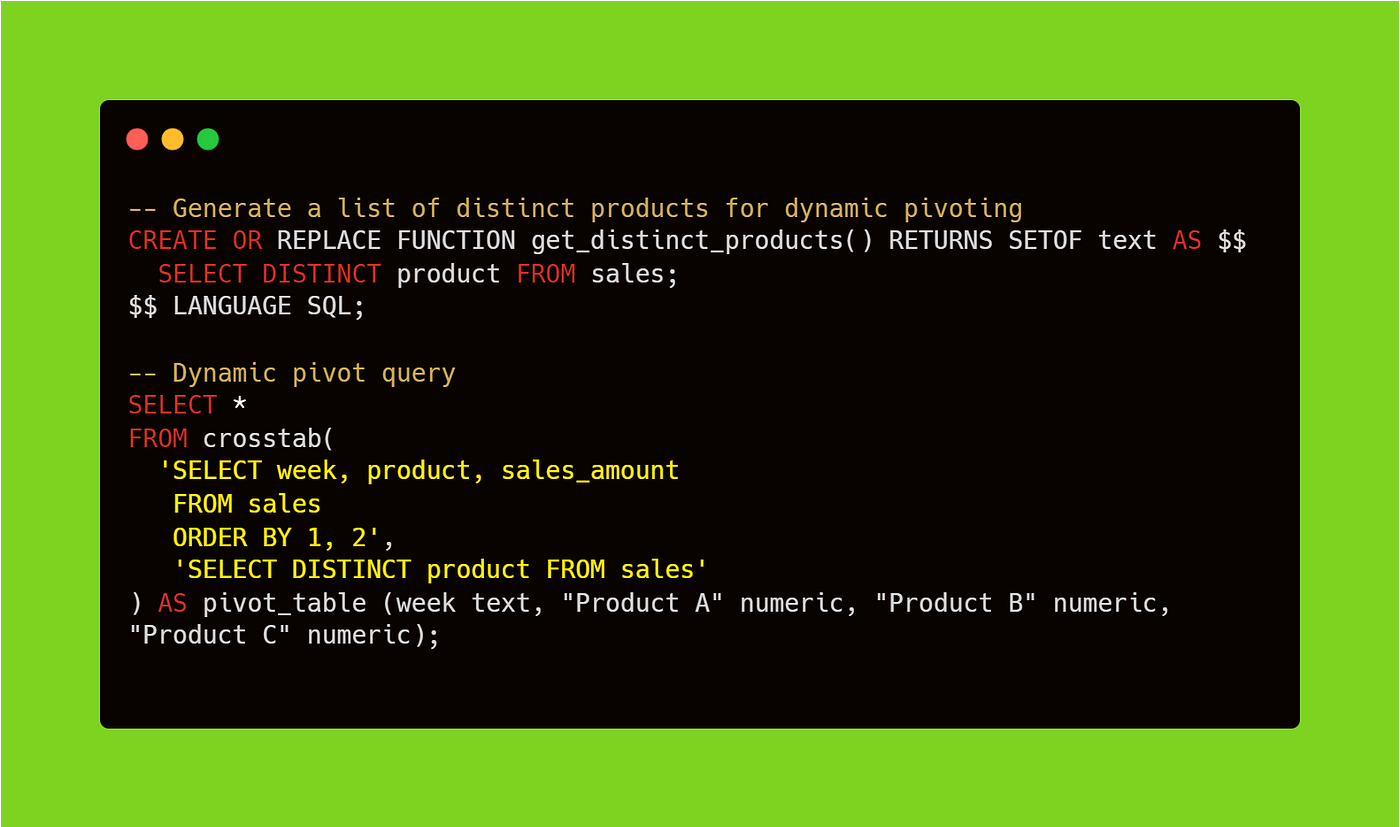
The true magic lies in dynamic pivoting, where your pivot table adapts to the changing nature of your data. Imagine you have products that can vary over time. Dynamic pivoting allows you to automatically adjust the columns based on the distinct product values present in your dataset:
Section 3: Crafting Aggregated Dynamic Pivot Tables
Dynamic pivot tables are not just about data transformation; they’re about data aggregation. In scenarios where you need to aggregate values before pivoting, the power of dynamic pivot tables becomes even more evident. Imagine calculating the total sales amount for each product within each quarter:

Section 4: Handling Null Values and Missing Data
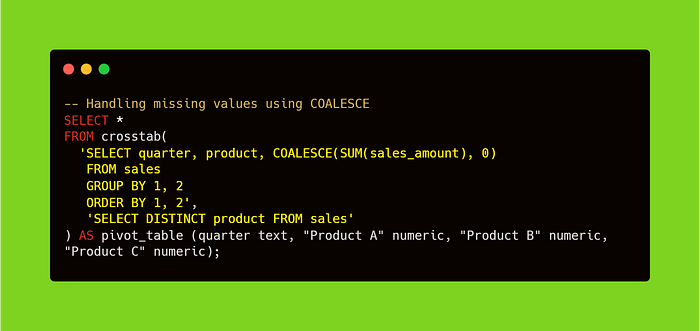
In the world of data, null values and missing data are inevitable. Dynamic pivot tables handle these gracefully, allowing you to fill in the gaps intelligently. Whether you’re dealing with missing values or nulls, your pivot table remains accurate and insightful.
Section 5: Dynamic Pivot Tables for Time-Series Data
Time-series data presents a unique challenge, but dynamic pivot tables rise to the occasion. Imagine you’re tracking daily sales for different products over time. Dynamic pivoting lets you transform this data into an intuitive format that reveals trends and patterns at a glance.

Section 6: Beyond Aggregation: Adding Context with Dynamic Pivot Tables
Dynamic pivot tables aren’t limited to simple aggregation; they can add context to your data. Imagine you want to calculate the sales growth rate for each product over time. Dynamic pivoting allows you to incorporate calculated fields into your pivot table.

Section 7: Performance Considerations for Dynamic Pivoting
While dynamic pivot tables offer unparalleled flexibility, they come with performance considerations. As your dataset grows, pivoting can become resource-intensive. Proper indexing, efficient query structuring, and strategic data management are crucial to maintaining query speed and database health.
Section 8: Practical Applications and Benefits
Dynamic pivot tables are not just a technical feat; they’re a tool that empowers data professionals across industries. From financial analysis and marketing insights to inventory management and trend forecasting, the applications are as diverse as the data they transform. The benefits? Clearer insights, streamlined reporting, and enhanced decision-making.
Section 9: Mastering the Art of Dynamic Pivot Tables
Dynamic pivot tables in PostgreSQL breathe new life into data manipulation and presentation. They offer a gateway to redefining how you interpret and share your data. With the power to adapt, aggregate, and contextualize, dynamic pivot tables stand as an essential skill in the arsenal of any data enthusiast. Unlock the transformative potential of your data and watch your analytical horizons expand like never before.